
Data Analysis
Tango AI empowers end-to-end data insight —
from engineering validation to stable high-volume production.
In the semiconductor manufacturing process, the ability to seamlessly connect engineering and production test data, and to monitor yield trends in real time, is critical for enhancing product quality and accelerating delivery timelines.
Tango AI provides powerful visual analytics to help you spot problems and respond instantly
Datalog Viewer – In-Depth Data Log Analysis × Versatile Chart Visualizations for Rapid Anomaly and Trend Detection
-
Supports all major test data formats, including STDF, SPD, CSV, and more
-
Single-lot, batch, and multi-site comparison analysis with one-click visualization
-
Built-in support for a wide range of analysis charts:
Histogram, Box Plot, Trend Plot, Jitter Plot, Scatter Plot, Probability Plot, CDF, and more
Enables engineers to quickly understand the behavior of each test item, accelerating debugging efficiency.

Wafer Detail View
Real-Time Defect Map Visualization
More than yield tracking
understand the story behind every die.
-
High-Resolution Wafer Map for Detailed Die-Level Visualization
-
Visualizes the test status of every individual die with high granularity
-
Supports bin distribution, parametric heatmaps, and pattern-based anomaly classification (Pattern Recognition)
-
Enables rapid filtering and comparison by product or test site
-
Applicable across CP, FT, and SLT stages for in-depth analysis

Yield Monitoring
Real-Time Abnormality Warning System
Transform yield anomaly management from reactive detection to real-time response
-
Tango AI Key Capabilities in Yield Monitoring and Alerting:
-
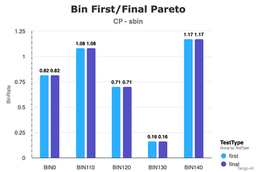
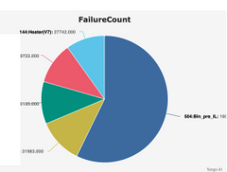
Automatically calculates key metrics such as Yield, First Pass Yield, Retest Rate, and Top Fail Bins
-
Enables rule-based anomaly alerts (e.g., Yield drop > X%, Bin shift detection)
-
Synchronizes with WIP flow for real-time updates and rapid assessment of process or test stability
Smart Dashboard –
Centralized Insights for Faster, Smarter Decisions
Transform complex data into simple, actionable decisions
-
Modular dashboard with drag-and-drop widgets (e.g., yield trends, site distribution, wafer map preview)
-
Customizable views tailored for cross-functional teams engineering, quality assurance, manufacturing, and management
-
Automated daily reports and anomaly summaries for continuous monitoring and quick response


